AI observability is becoming one of the most important parts of running generative AI products. A chatbot can appear to work while quietly becoming slower, more expensive or less reliable. It may answer some questions correctly, hallucinate on others, call the wrong tool or burn through tokens in the background. Traditional application monitoring can show that a service is online, but teams also need to understand what is happening inside the model and the workflows around it.
The term is gaining search momentum. Exploding Topics listed AI observability among its fastest-growing U.S. topics in November 2026, reporting 9,300% search growth through its proprietary trend methodology. That figure is a growth signal, not a verified monthly Google search count. The practical reason for the interest is clearer: as businesses put AI features into customer-facing products, they need ways to measure quality, cost and risk after launch.
What AI observability means—and why ordinary monitoring is not enough

AI observability is the practice of collecting and examining data about how AI systems behave in real use. It helps developers and operators understand not only whether a model endpoint is responding, but also what prompts and model calls are doing, how long each step takes, how many tokens are used, what a request costs and whether the output meets quality or safety expectations.
That distinction matters because an AI feature is often a chain of components. A user request may pass through an application server, a retrieval system, a language model, one or more external tools and a final response formatter. A failure anywhere in that chain can produce a bad answer. Without traces that connect the steps, teams may see only that the user received a poor response—not where the process went wrong.
Traditional monitoring still matters. CPU use, memory, uptime, network errors and database health remain essential. AI observability adds model-specific signals to that foundation. It is not a replacement for application performance monitoring; it is a way to extend it to systems whose behavior depends on prompts, probabilistic outputs, model providers and tool calls.
The metrics teams need to track: cost, latency, quality and safety

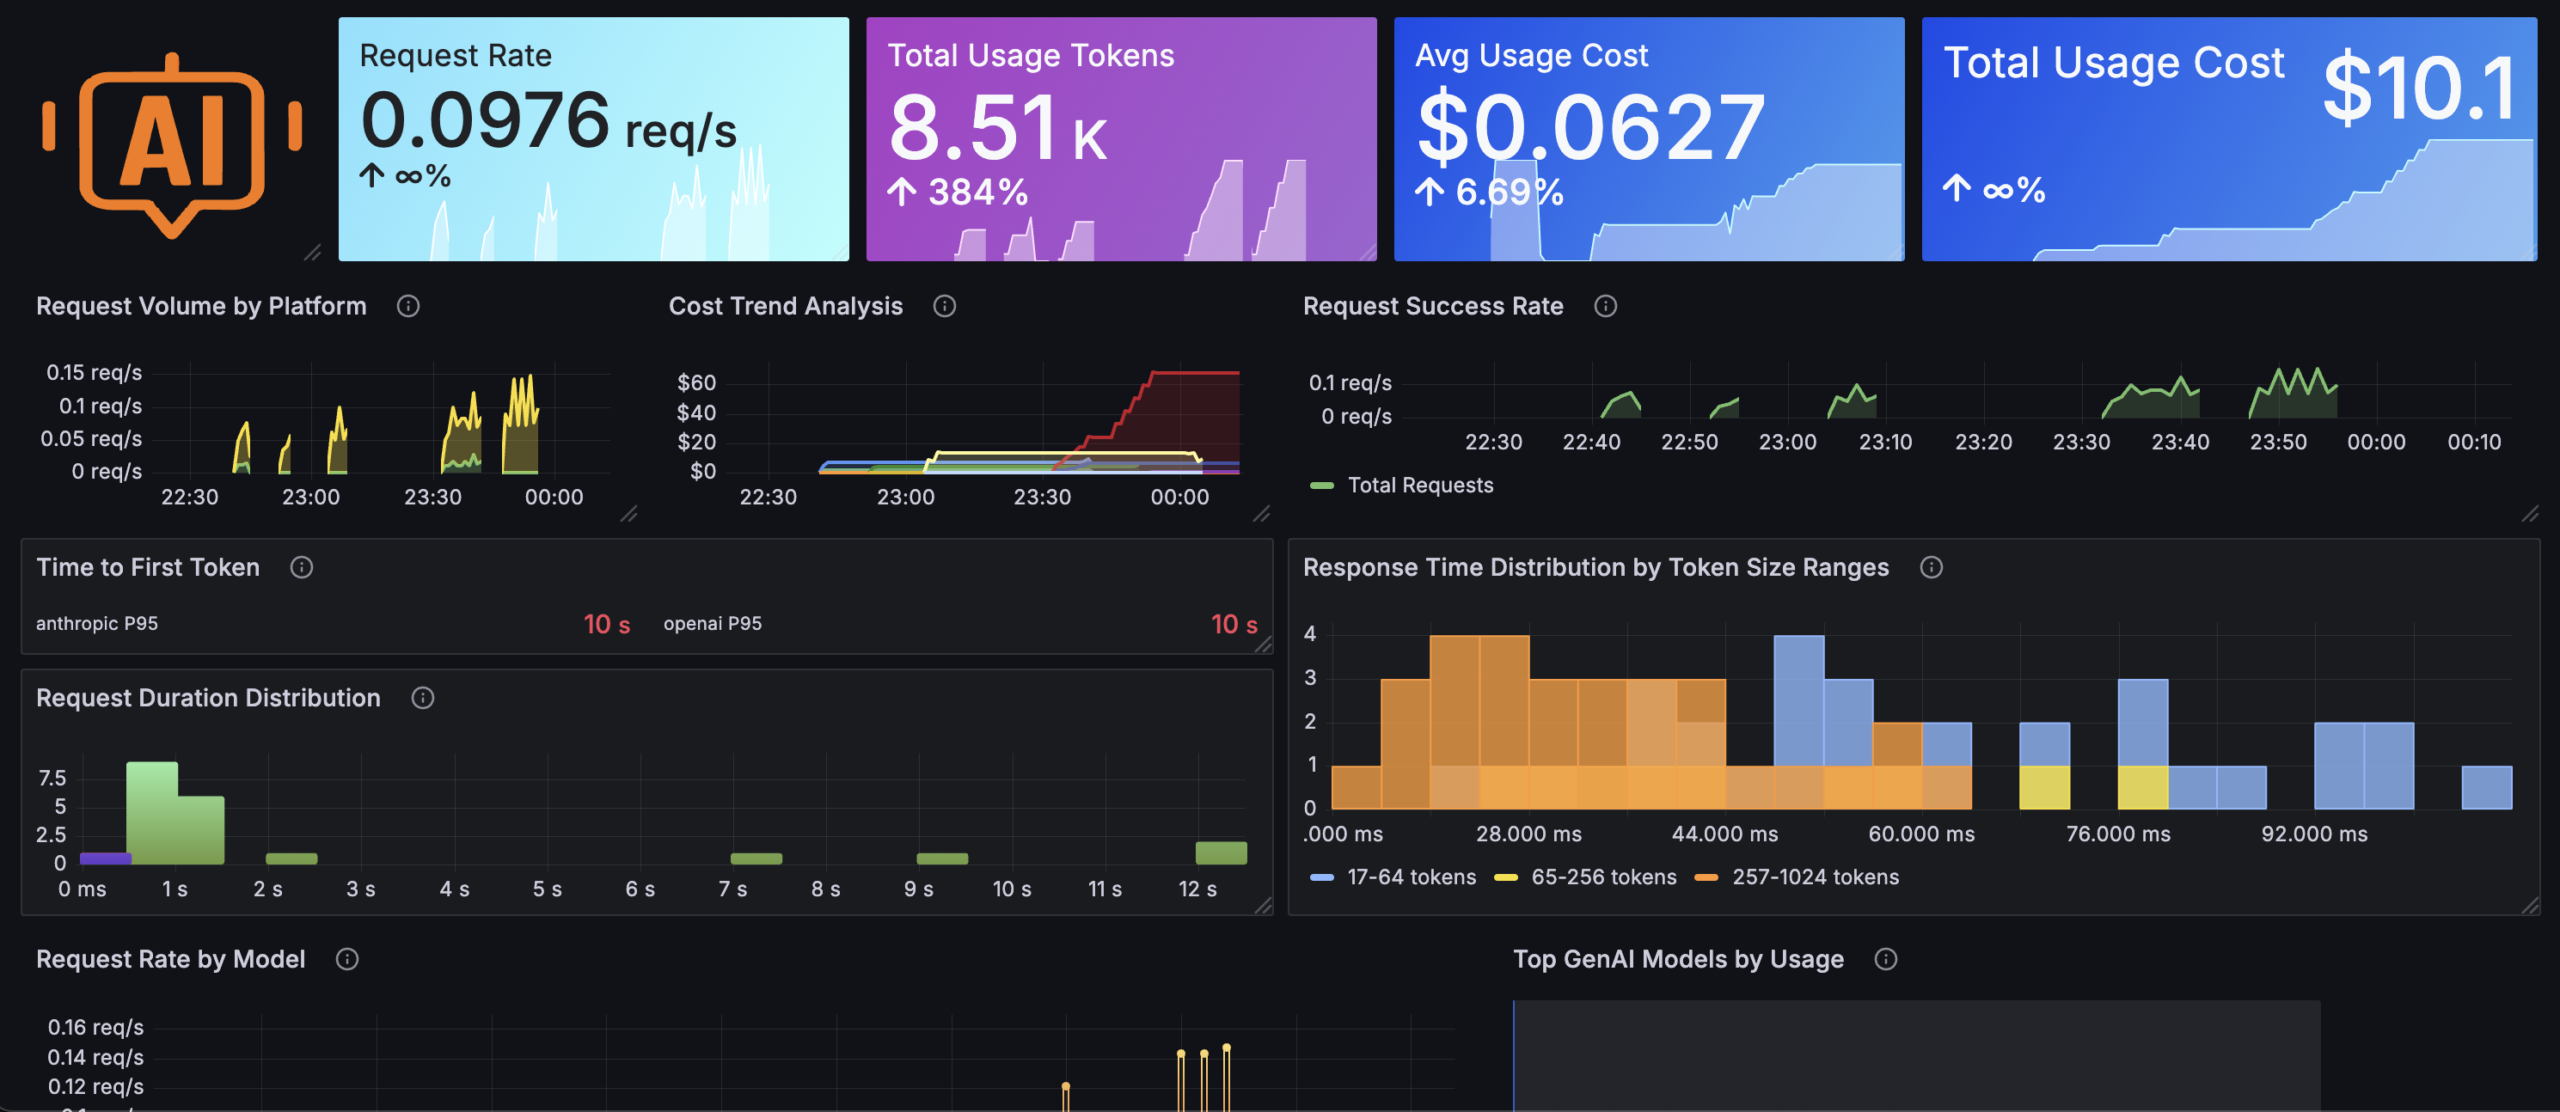
Latency and reliability: Track how long the full request takes, how long the model takes to begin responding, and where time is spent across model calls and tool use. Average latency can hide slow outliers, so teams often examine percentiles such as p95 as well as error and timeout rates.
Token use and cost: Monitor prompt tokens, completion tokens, model selection and estimated spend. A longer prompt or repeated agent call can increase costs without making the answer more useful. Cost should be examined by model, feature, customer or workflow—not only as one monthly total. Estimates can be incomplete when providers do not expose all usage details or pricing data is out of date.
Answer quality: Measure whether outputs are relevant, complete, grounded in supplied sources and consistent with the task. Teams may use human review, test datasets, automated evaluators or user feedback. Hallucination checks can help identify unsupported answers, but no single automated score proves that a response is true.
Safety and policy: Monitor blocked prompts, sensitive-data exposure, unsafe outputs, guardrail interventions and suspicious tool activity. The goal is to understand both whether safeguards are working and how often they interrupt legitimate requests.
The Grafana, PostHog and SigNoz documentation shows how current observability products organize these measurements around traces, tokens, costs, latency, errors and evaluation. See Grafana’s AI observability integration, PostHog’s AI observability dashboard and SigNoz’s AI observability guide.
How to build an AI observability practice without drowning in dashboards

Start with a small set of questions that matter to the product. Is the assistant answering correctly? Is it responding quickly enough? What does an average task cost? Which workflows fail most often? Are users reporting a specific kind of bad answer? Those questions are more useful than collecting every possible metric without a plan to act on it.
Next, instrument the full request path. Capture model and provider names, token counts, latency, errors and the sequence of tool calls. Distributed tracing standards such as OpenTelemetry can help connect AI spans to the surrounding application services. Teams should also decide what prompt and response data can safely be retained, mask personal information where appropriate and restrict access to sensitive traces.
Then establish a baseline using representative tasks. Test common questions, edge cases, tool failures and requests that should trigger safety rules. Compare model versions and prompt changes against the same evaluation set. A dashboard can reveal a sudden change, but repeatable tests help explain whether a release actually improved the product.
Finally, connect measurements to action. Set alerts for meaningful cost spikes, unusual error rates, latency regressions and safety events. Assign someone to investigate them. Review a sample of real outputs, update test cases when new failure patterns appear and keep a record of model or prompt changes so the team can connect a regression to a release.
Privacy deserves the same attention as performance. Logs can contain user questions, confidential business information or personal data. Teams should minimize what they store, set retention periods, apply access controls and make sure monitoring practices match their legal and contractual obligations.
AI observability is ultimately about making AI systems accountable in production. It gives teams a way to see when an assistant becomes slower, more expensive or less trustworthy—and to trace the reason back to a model, prompt, tool or data source. As AI features become ordinary parts of software, that visibility is shifting from a specialist extra to a basic operating requirement.


Leave a Reply